


Qml Custom Legend▲
This application shows you how to create your own custom legend instead of using the built-in legend of ChartView API.
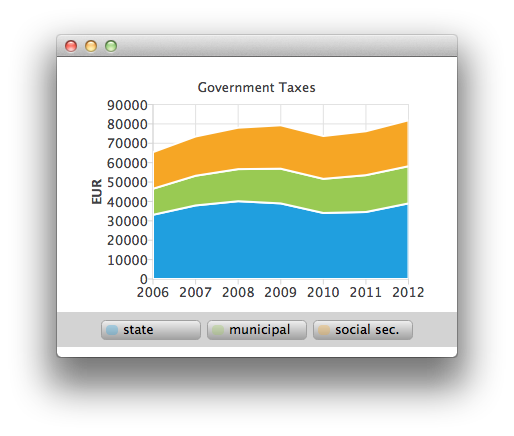
The main view of the application shows a stacked area chart. This is how one of the stacked areas is created. See ChartViewStacked.qml and AnimatedAreaSeries.qml.
Running the Example▲
To run the example from Qt Creator, open the Welcome mode and select the example from Examples. For more information, visit Building and Running an Example.
Customizing Legends▲
Sélectionnez
AnimatedAreaSeries {
    id: municipalSeries
    name: "municipal"
    axisX: axisX
    axisY: axisY
    borderWidth: 0
    upperSeries: LineSeries {
        id: municipalUpper
        XYPoint { x: 2006; y: 33119 + 13443 }
        XYPoint { x: 2007; y: 37941 + 15311 }
        XYPoint { x: 2008; y: 40122 + 16552 }
        XYPoint { x: 2009; y: 38991 + 17904 }
        XYPoint { x: 2010; y: 34055 + 17599 }
        XYPoint { x: 2011; y: 34555 + 19002 }
        XYPoint { x: 2012; y: 38991 + 19177 }
    }
    lowerSeries: stateUpper
}
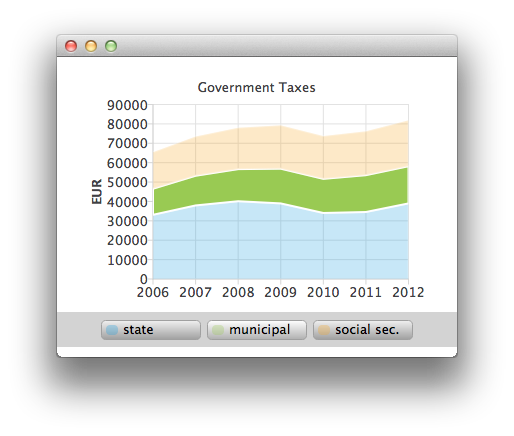
Hovering with mouse on top of the legend will highlight the hovered series. (see CustomLegend.qml).
Sélectionnez
Row {
    id: legendRow
    anchors.centerIn: parent
    spacing: 10

    Repeater {
        id: legendRepeater
        model: seriesCount
        delegate: legendDelegate
    }
}
Component {
    id: legendDelegate
    Rectangle {
        id: rect
    ...
        MouseArea {
            id: mouseArea
            anchors.fill: parent
            hoverEnabled: true
            onEntered: {
                rect.gradient = buttonGradientHovered;
                legend.entered(label.text);
            }
            onExited: {
                rect.gradient