


AreaChart Example▲
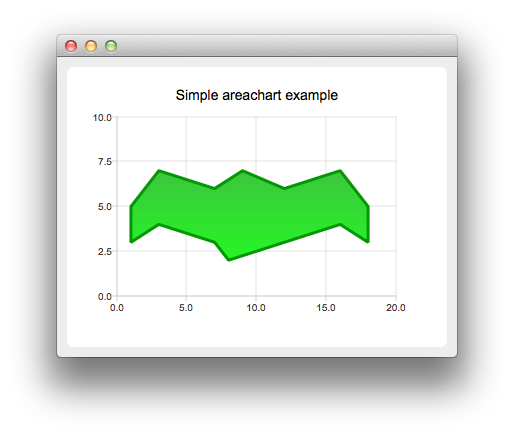
Running the Example▲
To run the example from Qt Creator, open the Welcome mode and select the example from Examples. For more information, visit Building and Running an Example.
Creating Area Charts▲
To create area charts, we need two QLineSeries instances. They are going to define the upper and lower boundary of the area.
Sélectionnez
    QLineSeries *series0 = new QLineSeries();
    QLineSeries *series1 = new QLineSeries();
We add data to both series and use the stream operator.
Sélectionnez
    *series0 << QPointF(1, 5) << QPointF(3, 7) << QPointF(7, 6) << QPointF(9, 7) << QPointF(12, 6)
             << QPointF(16, 7) << QPointF(18, 5);
    *series1 << QPointF(1, 3) << QPointF(3, 4) << QPointF(7, 3) << QPointF(8, 2) << QPointF(12, 3)
             << QPointF(16, 4) << QPointF(18, 3);
Now we create a QAreaSeries instance using two line series objects. We set the custom gradient fill and width of the outline.
Sélectionnez
    QAreaSeries *series = new QAreaSeries(series0, series1);
    series->setName("Batman");
    QPen pen(0x059605);
    pen.setWidth(3);
    series->setPen(pen);

    QLinearGradient gradient(QPointF(0, 0), QPointF(0, 1));
    gradient.setColorAt(0.0, 0x3cc63c);
    gradient.setColorAt(1.0, 0x26f626);
    gradient.setCoordinateMode(QGradient::ObjectBoundingMode);
    series->setBrush(gradient);
Last we create the QChartView instance, set the title, set anti-aliasing, and add the area series. We also create the default axes and specify the ranges on them.
Sélectionnez
    QChart *chart = new QChart();
    chart->addSeries(series);
    chart->setTitle("Simple areachart example");
    chart->createDefaultAxes();
    chart->axes(Qt::Horizontal).first()->setRange(0, 20);
    chart->axes(Qt::Vertical).first()->setRange(0, 10);
The chart is ready to be shown.
Sélectionnez
    QChartView *chartView = new QChartView(chart);
    chartView->setRenderHint(QPainter::Antialiasing);