


SelectedBar Example▲
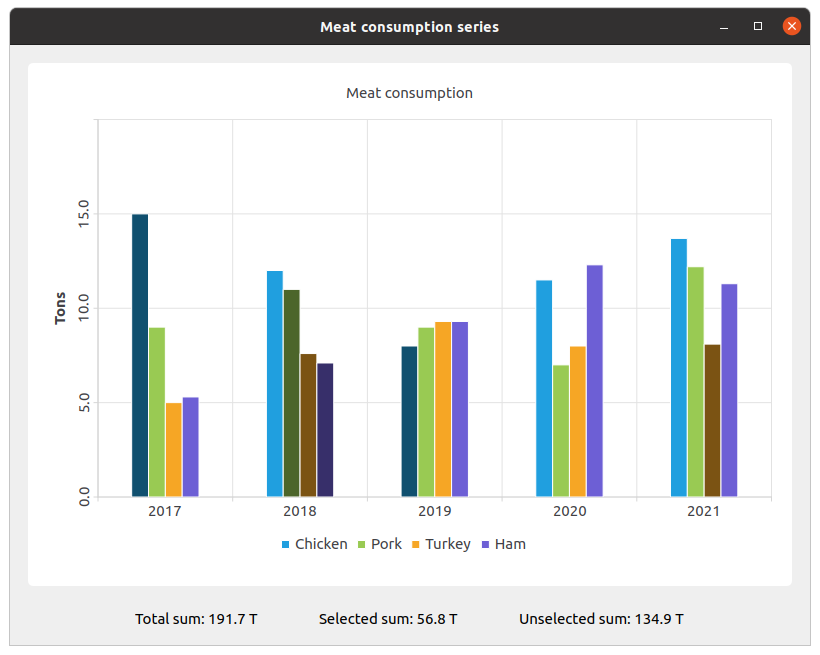
The example shows changing the color and state of bars using the selection feature.
Running the Example▲
To run the example from Qt Creator, open the Welcome mode and select the example from Examples. For more information, visit Building and Running an Example.
Using setBarSelected()▲
We create the sets and fill them with the data. Then we create a series and append data to it.
QBarSet *setChicken = Utilities::createChickenSet();
QBarSet *setPork = Utilities::createPorkSet();
QBarSet *setTurkey = Utilities::createTurkeySet();
QBarSet *setHam = Utilities::createHamSet();
qreal totalSum = setChicken->sum() + setPork->sum() + setTurkey->sum() + setHam->sum();
QList<QBarSet *> setList = QList<QBarSet *>{setChicken, setPork, setTurkey, setHam};

QBarSeries *series = new QBarSeries();
series->append(setList);
We create the chart and add series to it. Also, we add a title to the chart, set animation for the chart, and align the legend.
QChart *chart = new QChart();
chart->addSeries(series);
chart->setTitle(QCoreApplication::tr("Meat consumption"));
chart->setAnimationOptions(QChart::SeriesAnimations);
chart->legend()->setVisible(true);
chart->legend()->setAlignment(Qt::AlignBottom);
Here we set the color for the selected bars.
for (QBarSet *barSet : series->barSets())
    barSet->setSelectedColor(barSet->brush().color().darker());
Next step is adding axes: QBarCategoryAxis for years of measurements and QValueAxis for values range.
QStringList categories = Utilities::createYearCategories();
QBarCategoryAxis *axisX = new QBarCategoryAxis();
axisX->setCategories(categories);
chart->addAxis(axisX, Qt::AlignBottom);
series->attachAxis(axisX);

QValueAxis *axisY = new QValueAxis();
axisY->setRange(0, 20);
axisY->setTitleText(QCoreApplication::tr("Tons"));
axisY->setLabelsAngle(-90);
axisY->setTitleVisible(true);
chart->addAxis(axisY, Qt::AlignLeft);
series->attachAxis(axisY);
Then we add the chart view to put the chart in.
QChartView *chartView = new QChartView(chart);
chartView->setRenderHint(QPainter::Antialiasing);
Here we create a widget for labels of values of selected and unselected bars.
QWidget *labelWidget = new QWidget(&mainWindow);
QHBoxLayout *labelLayout = new QHBoxLayout(labelWidget);
labelLayout->setAlignment(Qt::AlignCenter);

QLabel *totalSumLabel = new QLabel(QCoreApplication::tr("Total sum: %1 T").arg(totalSum));
labelLayout->addWidget(totalSumLabel);
totalSumLabel->setContentsMargins(0, 0, 54, 0);

QLabel *selectedSumLabel = new QLabel(QCoreApplication::tr("Selected sum: 0 T"));
labelLayout->addWidget(selectedSumLabel);

QLabel *unselectedSumLabel = new QLabel(QCoreApplication::tr("Unselected sum: %1 T").arg(totalSum));
labelLayout->addWidget(unselectedSumLabel);
unselectedSumLabel->setContentsMargins(54, 0, 0, 0);
We connect selecting of a specific bar with labels of values using a lambda. set->toggleSelection({index}) sets the bar selected.
QObject::connect(series, &QAbstractBarSeries::clicked, series, [=](int index, QBarSet *set) {
    set->toggleSelection({index});
    qreal selectedSum = 0.;
    for (int i = 0; i < setList.size(); ++i) {
        auto selectedIndices = setList.at(i)->selectedBars();
        for (int k = 0; k < selectedIndices.size(); ++k)
            selectedSum += setList.at(i)->at(selectedIndices.at(k));
    }
    selectedSumLabel->setText(QCoreApplication::tr("Selected sum: %1 T").arg(selectedSum));
    // Because of rounding errors, selectedSum can result in being bigger than total sum
    qreal unselectedSum = totalSum - selectedSum < 0 ? 0. : totalSum - selectedSum;
    unselectedSumLabel->setText(
                                QCoreApplication::tr("Unselected sum: %1 T")
                                .arg(unselectedSum)
                               );
});
Finally, we create the main widget and add other layouts to it and run the application.
QWidget *mainWidget = new QWidget(&mainWindow);
QVBoxLayout *mainLayout = new QVBoxLayout(mainWidget);

mainLayout->addWidget(chartView);
mainLayout->addWidget(labelWidget);

mainWindow.setCentralWidget(mainWidget);
mainWindow.resize(800, 600);

mainWindow.show();
return a.exec();