- Accueil Actualités IT Pro
- Conception Cycle de vie du logiciel
- Java Plateforme et langage Java
- .NET Microsoft Framework .NET
- Dév. Web Développement Web et Webmarketing
- EDI Environnements de Développement Intégré
- Langages Langages de programmation applicatifs
- SGBD Systèmes de Gestion de Bases de Données
- Office Bureautique pour l'entreprise
- Solutions d'entreprise Autres logiciels pour l'entreprise
- Applications Applications logicielles
- Systèmes Logiciels et matériels systèmes
Detecting Memory LeaksYou can use the Memcheck tool included in the Valgrind tool suite to detect problems that are related to memory management in applications. Note: Memcheck is supported locally on Linux and Mac OS. You can run it on a remote host from Windows. After you download and install Valgrind tools, you can use Memcheck from Qt Creator. To analyze applications:
While the application is running, Memcheck checks all reads and writes of memory and intercepts calls that allocate or free memory or create or delete memory blocks. When you stop Memcheck, it displays the results in the Analysis view. Click a line to view where a memory leak occurred and a stack trace that shows what caused it.
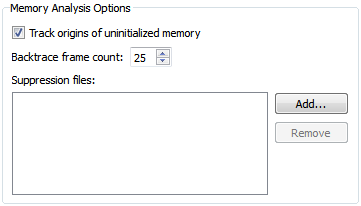
Move the mouse on on a row to view more information about the function. For more information about using Memcheck, see Interpreting Memcheck's Output in the Valgrind documentation. Selecting Options for Memory AnalysisStack traces can get quite large and confusing, and therefore, reading them from the bottom up can help. If the stack trace is not big enough or it is too big, select Tools > Options... > Analyzer. Define the length of the stack trace in the Backtrace frame count field.
Memcheck also reports uses of uninitialised values, most commonly with the message Conditional jump or move depends on uninitialised value(s). To determine the root cause of these errors, the Track origins of uninitialized memory check box is selected by default. You can deselect it to make Memcheck run faster. Memcheck detects numerous problems in the system libraries, such as the C library, which come pre-installed with your OS. As you cannot easily fix them, you want to suppress them. Valgrind reads a list of errors to suppress at startup. A default suppression file is created by the ./configure script when the system is built. You can write your own suppression files if parts of your project contain errors you cannot fix and you do not want to be reminded of them. Click Add in the Memory Analysis dialog to add the suppression files. For more information about writing suppression files, see Suppressing Errors in the Valgrind documentation. [Previous: Profiling QML Applications] [Next: Profiling Function Execution] © 2008-2011 Nokia Corporation and/or its subsidiaries. Nokia, Qt and their respective logos are trademarks of Nokia Corporation in Finland and/or other countries worldwide. All other trademarks are property of their respective owners. Privacy Policy Licensees holding valid Qt Commercial licenses may use this document in accordance with the Qt Commercial License Agreement provided with the Software or, alternatively, in accordance with the terms contained in a written agreement between you and Nokia. Alternatively, this document may be used under the terms of the GNU Free Documentation License version 1.3 as published by the Free Software Foundation. X
|


 button to start the application.
 button to view the results of the analysis in the Analysis view.
