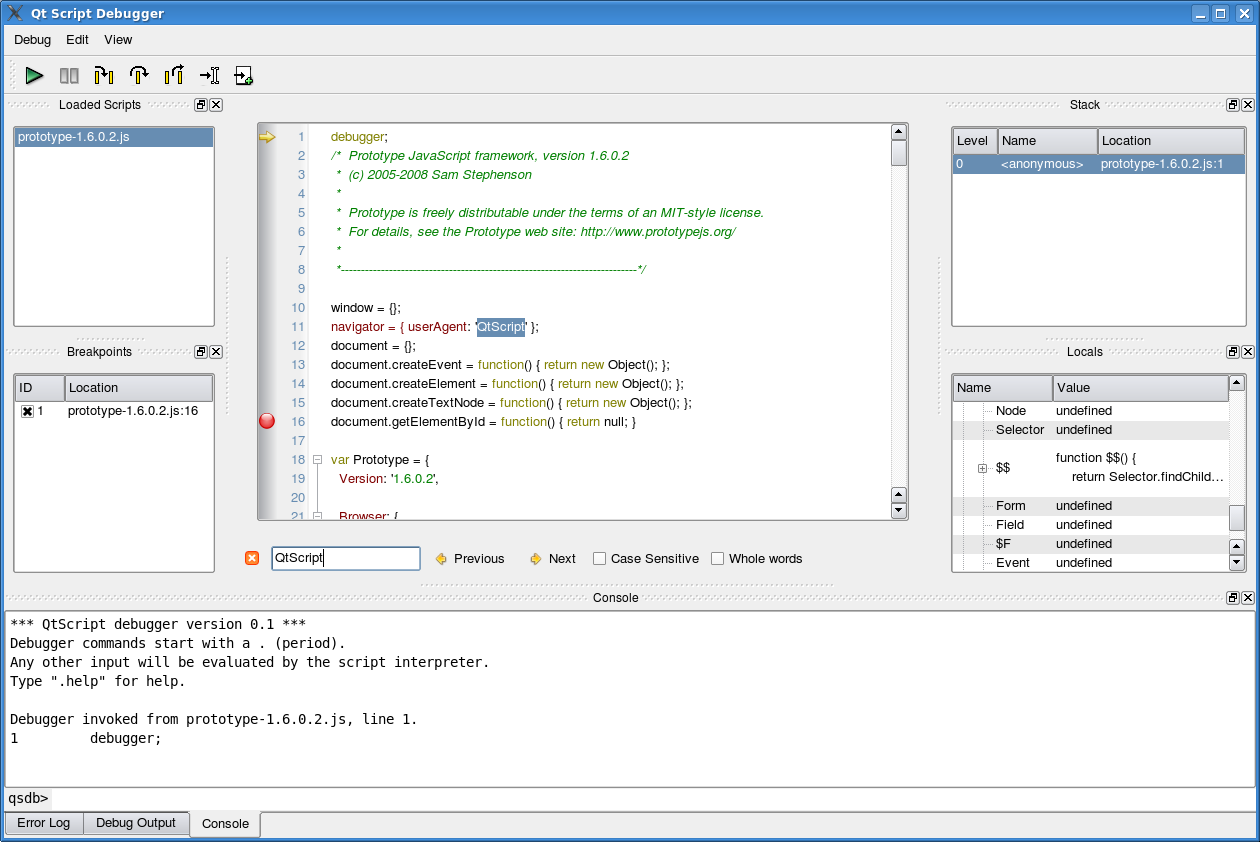
Qt Script Debugger ManualThe Qt Script debugger is a tool for debugging script execution in Qt applications that use Qt Script. Application developers can embed the debugger into their application through the QScriptEngineDebugger class. This manual describes how to use the debugger. We assume that the reader is somewhat familiar with general debugging concepts and existing debugging tools. We assume that the debugger has been integrated into the application through the QScriptEngineDebugger::standardWindow() function, which provides the standard debugger configuration. Getting StartedThe following image shows the debugger as created with standardWindow():
The debugger will start, i.e., take control over the script's execution when any of these conditions are met:
Once the debugger is started, the execution state can be inspected, e.g., the value of variables can be queried and the current program stack shown. New breakpoints can be set. The debugger will resume, i.e., give the control back to the script engine, when the user clicks Continue menu item from the Debug menu. It will be invoked again if one of the conditions described in the list above is met. Overview of Debugger ComponentsThe debugger's functionality is divided into a series of components, each being a widget that can be shown in the main window of the debugger. The following table describes each component and how they relate to each other.
Resuming Script EvaluationScript evaluation can be resumed in one of the following ways:
In any case, script evaluation can also be stopped due to either of the following reasons:
Resuming After an Uncaught ExceptionWhen an uncaught script exception occurs, it is not possible to continue evaluating the current function normally. However, you can use the console command return to catch the exception and return a value to the calling function. Console Command ReferenceNote that you can also get help on the available commands by typing ".help" in the console. Breakpoint-related CommandsBreak points is set break <location>Sets a breakpoint at a given code line. .break foo.qs:123 This command sets a breakpoint at foo.qs, line 123. .break 123 This command sets a breakpoint at line 123 in the current script; the current script is the script associated with the current stack frame. Each breakpoint has a unique identifier (an integer) associated with it. This identifier is needed by other breakpoint-related commands. clear <location>.clear foo.qs:123 clears (deletes) the breakpoint at foo.qs, line 123. clear 123
clears (deletes) the breakpoint at line 123 in the current script; the current script is the script associated with the current stack frame. condition <breakpoint-id> <expression>Sets a condition for a breakpoint. .condition 1 i > 42 specifies that breakpoint 1 should only be triggered if the variable i is greater than 42. The expression can be an arbitrary one, i.e. it can have side-effects. It can be any valid QScript conditional expression. delete <breakpoint-id>Deletes a breakpoint, i.e., removes it from the current debugging session. disable <breakpoint-id>Disables a breakpoint. The breakpoint will continue to exist, but will not stop program execution. enable <breakpoint-id>Enables a breakpoint. Breakpoints are enabled by default, so you only need to use this command if you have disabled to breakpoint previously. ignore <breakpoint-id> <count>Sets the ignore-count of a breakpoint, i.e., the breakpoint will not stop the program execution unless it have been reached count times. This can, for instance, be useful in loops to stop at a specific iteration. .ignore 1 5 Specifies that breakpoint 1 should be ignored the next 5 times it is hit. info breakpointsLists the breakpoints that are set. .info breakpoints
tbreak <location>Sets a temporary breakpoint. This command is identical to the break command, only the breakpoint will be automatically deleted the first time it is hit. File-related Commandslist <location>Lists the contents of a script around a given location, where the location is given as a line number and, optionally, the name of the file from which you will print. If only a line number is given, .list will use the file of the current stack frame. .list foo.qs:125 When no arguments are given, list will incrementally list sections of the current script. info scriptsLists the scripts that are currently loaded. Execution-related Commandsadvance <location>Advances execution to a given location. The syntax of the location is the same as for setting breakpoints. For example: .advance foo.qs:125 continueContinues execution normally, i.e, gives the execution control over the script back to the QScriptEngine. eval <program>Evaluates a program. finishContinues execution until the current function exits and the next statement is reached (i.e., the statement after the call to the function). interruptRequests that execution should be interrupted. Interruption will occur as soon as a new script statement is reached. next <count = 1>Continues execution until a new statement is reached; but if the current statement is a function call, the function call will be treated as a single statement. This will be done count times before execution is stopped; the default is one. return <expression>Makes the current frame return to its caller. If expression is given, it will sent as the result of the function (i.e., replacing the functions return value). expression can be any valid QScript expression. step <count = 1>Continues execution until a new statement is reached. If the number count is given as argument, this will be done count times before execution is stopped. As opposed to next <count = 1>, step will enter functions when encountering a function call statement. Stack-related CommandsbacktraceShows a backtrace of the current execution. The trace will list the function name and its position in the script for each stack frame. downSelects the previous (inner) stack frame. The execution will not return to this frame, but you will get access to its local variables. frame <index>This command moves to the stack frame with the given index. The index of the frame on the top of the stack is 0. Previous frames are numbered from 1 and upwards (the bottom frame in the stack has the largest index). info localsLists the variables that are in the scope of the current frame. upSelects the next (outer) stack frame. |


