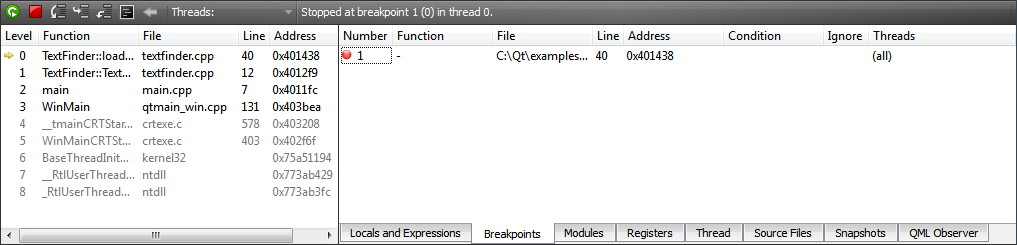
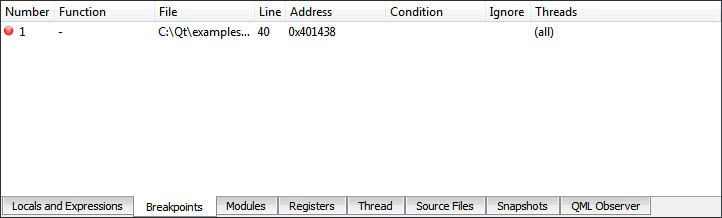
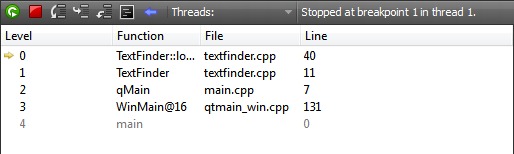
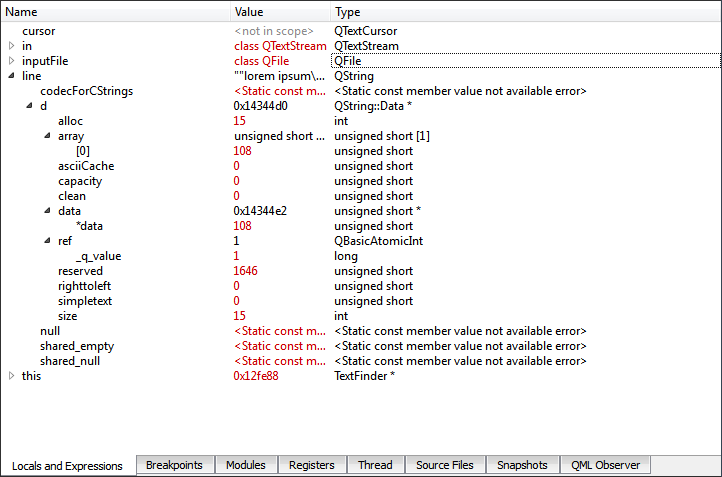
Interacting with the DebuggerIn Debug mode, you can use several views to interact with the program you are debugging. Frequently used views are shown by default and rarely used ones are hidden. To change the default settings, select Debug > Views, and then select views to display or hide. You can also lock views. The position of views is saved for future sessions. To start a program under the debugger's control, select Debug > Start Debugging > Start Debugging, or press F5. Qt Creator checks whether the compiled program is up-to-date, rebuilding it if necessary. The debugger then takes over and starts the program. Note: Starting a program in the debugger can take a considerable amount of time, typically in the range of several seconds to minutes if complex features (like QtWebKit) are used. Once the program starts running, it behaves and performs as usual. You can interrupt a running program by selecting Debug > Interrupt. The program is automatically interrupted as soon as a breakpoint is hit. Once the program stops, Qt Creator: You can use the Debug mode views to examine the data in more detail. You can use the following keyboard shortcuts: It is also possible to continue executing the program until the current function completes or jump to an arbitrary position in the current function. A breakpoint represents a position or sets of positions in the code that, when executed, interrupts the program being debugged and passes the control to you. You can then examine the state of the interrupted program, or continue execution either line-by-line or continuously. Qt Creator shows breakpoints in the Breakpoints view which is enabled by default. The Breakpoints view is also accessible when the debugger and the program being debugged is not running. Typically, breakpoints are associated with a source code file and line, or the start of a function -- both are allowed in Qt Creator. The interruption of a program by a breakpoint can be restricted with certain conditions. To set a breakpoint: Note: You can remove a breakpoint: You can set and delete breakpoints before the program starts running or while it is running under the debugger's control. Breakpoints are saved together with a session. When the program being debugged is interrupted, Qt Creator displays the nested function calls leading to the current position as a call stack trace. This stack trace is built up from call stack frames, each representing a particular function. For each function, Qt Creator tries to retrieve the file name and line number of the corresponding source file. This data is shown in the Stack view. Since the call stack leading to the current position may originate or go through code for which no debug information is available, not all stack frames have corresponding source locations. Stack frames without corresponding source locations are grayed out in the Stack view. If you click a frame with a known source location, the text editor jumps to the corresponding location and updates the Locals and Watchers view, making it seem like the program was interrupted before entering the function. If a multi-threaded program is interrupted, the Thread view or the combobox named Thread in the debugger's status bar can be used to switch from one thread to another. The Stack view adjusts itself accordingly. The Modules view and Source Files views display information that the debugger plugin has about modules and source files included in the project. The Modules view lists the modules in the project and symbols within the modules. In addition, it indicates where the module was loaded. The Source Files view lists all the source files included in the project. If you cannot step into an instruction, you can check whether the source file is actually part of the project, or whether it was compiled elsewhere. The view shows the path to each file in the file system. By default, the Modules view and Source Files view are hidden. The Disassembler view displays disassembled code for the current function. The Registers view displays the current state of the CPU's registers. The Disassembler view and the Registers view are both useful for low-level commands for checking single instructions, such as Step Into and Step Over. By default, both Disassembler and Registers view are hidden. Whenever a program stops under the control of the debugger, it retrieves information about the topmost stack frame and displays it in the Locals and Watchers view. The Locals and Watchers view typically includes information about parameters of the function in that frame as well as the local variables. Compound variables of struct or class type are displayed as expandable in the view. Expand entries to show all members. Together with the display of value and type, you can examine and traverse the low-level layout of object data. Note: Gdb, and therefore Qt Creator's debugger works for optimized builds on Linux and Mac OS X. Optimization can lead to re-ordering of instructions or removal of some local variables, causing the Locals and Watchers view to show unexpected data. The debug information provided by gcc does not include enough information about the time when a variable is initialized. Therefore, Qt Creator can not tell whether the contents of a local variable contains "real data", or "initial noise". If a QObject appears uninitialized, its value is reported as not in scope. Not all uninitialized objects, however, can be recognized as such. The Locals and Watchers view also provides access to the most powerful feature of the debugger: comprehensive display of data belonging to Qt's basic objects. To enable Qt's basic objects data display feature: For example, in case of QObject, instead of displaying a pointer to some private data structure, you see a list of children, signals and slots. Similarly, instead of displaying many pointers and integers, Qt Creator's debugger displays the contents of a QHash or QMap in an orderly manner. Also, the debugger displays access data for QFileInfo and provides access to the "real" contents of QVariant. You can use the Locals and Watchers view to change the contents of variables of simple data types, for example, int or float when the program is interrupted. To do so, click the Value column, modify the value with the inplace editor, and press Enter (or Return). Note: The set of watched items is saved in your session.
X
|