Interacting with the DebuggerIn Debug mode, you can use several views to interact with the program you are debugging. The availability of views depends on whether you are debugging C++ or QML. Frequently used views are shown by default and rarely used ones are hidden. To change the default settings, select Window > Views, and then select views to display or hide.
By default, the views are locked into place in the workspace. Select Window > Views > Locked to unlock the views. Drag and drop the views into new positions on the screen. Drag view borders to resize the views. The size and position of views are saved for future sessions. Select Window > Views > Reset to Default Layout to reset the views to their original sizes and positions. Using the DebuggerOnce the program starts running under the control of the debugger, it behaves and performs as usual. You can interrupt a running C++ program by selecting Debug > Interrupt. The program is automatically interrupted when a breakpoint is hit. Once the program stops, Qt Creator:
You can use the Debug mode views to examine the data in more detail. You can use the following keyboard shortcuts:
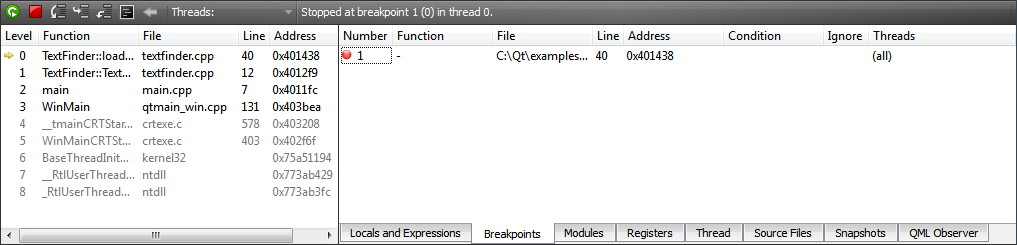
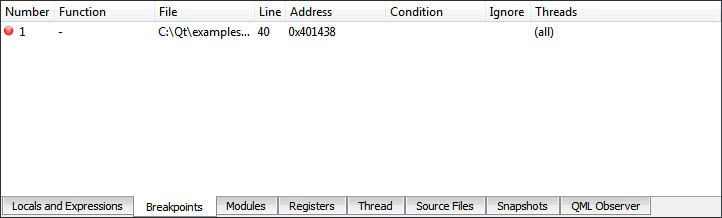
It is also possible to continue executing the program until the current function completes or jump to an arbitrary position in the current function. Setting BreakpointsA breakpoint represents a position or sets of positions in the code that, when executed, interrupts the program being debugged and passes the control to you. You can then examine the state of the interrupted program, or continue execution either line-by-line or continuously. Qt Creator shows breakpoints in the Breakpoints view which is enabled by default. The Breakpoints view is also accessible when the debugger and the program being debugged is not running.
You can associate breakpoints with:
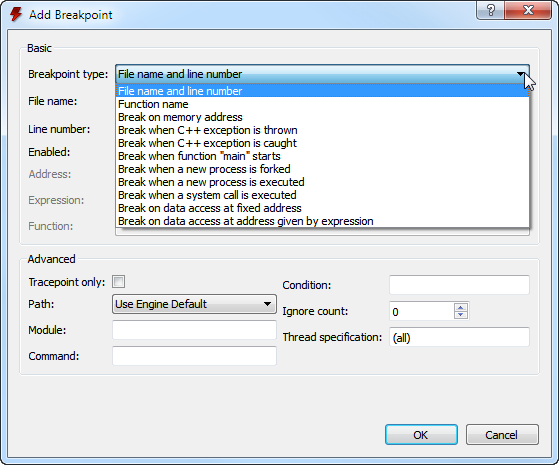
The interruption of a program by a breakpoint can be restricted with certain conditions. To set a breakpoint at a particular line you want the program to stop, click the left margin or press F9 (F8 for Mac OS X). To set breakpoints, select Add Breakpoint... in the context menu in the Breakpoints view.
Note: You can remove a breakpoint:
You can set and delete breakpoints before the program starts running or while it is running under the debugger's control. Breakpoints are saved together with a session. Setting Data BreakpointsTo set a data breakpoint at an address:
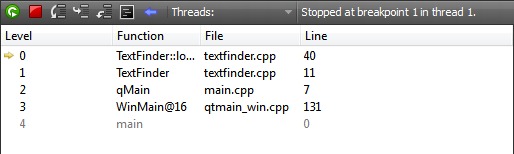
If the address is displayed in the Locals and Expressions view, you can select Add Data Breakpoint at Object's Address in the context menu to set the data breakpoint. Viewing Call Stack TraceWhen the program being debugged is interrupted, Qt Creator displays the nested function calls leading to the current position as a call stack trace. This stack trace is built up from call stack frames, each representing a particular function. For each function, Qt Creator tries to retrieve the file name and line number of the corresponding source file. This data is shown in the Stack view.
Since the call stack leading to the current position may originate or go through code for which no debug information is available, not all stack frames have corresponding source locations. Stack frames without corresponding source locations are grayed out in the Stack view. If you click a frame with a known source location, the text editor jumps to the corresponding location and updates the Locals and Expressions view, making it seem like the program was interrupted before entering the function. Locals and ExpressionsWhenever a program stops under the control of the debugger, it retrieves information about the topmost stack frame and displays it in the Locals and Expressions view. The Locals and Expressions view typically includes information about parameters of the function in that frame as well as the local variables.
Compound variables of struct or class type are displayed as expandable in the view. Expand entries to show all members. Together with the display of value and type, you can examine and traverse the low-level layout of object data.
The Locals and Expressions view also provides access to the most powerful feature of the debugger: comprehensive display of data belonging to Qt's basic objects. To enable Qt's basic objects data display feature:
For example, in case of QObject, instead of displaying a pointer to some private data structure, you see a list of children, signals and slots. Similarly, instead of displaying many pointers and integers, Qt Creator's debugger displays the contents of a QHash or QMap in an orderly manner. Also, the debugger displays access data for QFileInfo and provides access to the "real" contents of QVariant. You can use the Locals and Expressions view to change the contents of variables of simple data types, for example, int or float when the program is interrupted. To do so, click the Value column, modify the value with the inplace editor, and press Enter (or Return). You can enable tooltips in the main editor displaying this information. For more information, see Showing Tooltips in Debug Mode. Note: The set of evaluated expressions is saved in your session. Directly Interacting with Native DebuggersIn some cases, it is convenient to directly interact with the command line of the native debugger. In Qt Creator, you can use the left pane of the Debugger Log view for that purpose. When you press Ctrl+Return, the contents of the line under the text cursor are sent directly to the native debugger. Alternatively, you can use the line edit at the bottom of the view. Output is displayed in the right pane of the Debugger Log view. Note: Usually, you do not need this feature, because Qt Creator provides you with better ways to handle the task. For example, instead of using the GDB print command from the command line, you can evaluate an expression in the Locals and Expressions view. Debugging C++ Based ApplicationsThe following sections describe additional debugging functions that apply only to debugging C++. Starting the Debugger from the Command LineYou can use the Qt Creator debugger interface from the command line. To attach it to a running process, specify the process ID as a parameter for the -debug option. To examine a core file, specify the file name. Qt Creator executes all the necessary steps, such as searching for the binary that belongs to a core file. For example:
For more information, see Using Command Line Options. Stepping into Frameworks in Mac OSIn Mac OS X, external libraries are usually built into so-called Frameworks, which may contain both release and debug versions of the library. When you run applications on the Mac OS desktop, the release version of Frameworks is used by default. To step into Frameworks, select the Use debug versions of Frameworks option in the project run settings for Desktop and Qt Simulator targets. Viewing ThreadsIf a multi-threaded program is interrupted, the Thread view or the combobox named Thread in the debugger's status bar can be used to switch from one thread to another. The Stack view adjusts itself accordingly. Viewing ModulesThe Modules view displays information that the debugger plugin has about modules included in the application that is being debugged. A module is a dynamic link library (.dll) in Windows, a shared object (.so) in Linux, and a dynamic shared library (.dylib) in Mac OS. In addition, the view displays symbols within the modules and indicates where each module was loaded. Right-click the view to open a context menu that contains menu items for:
By default, the Modules view is hidden. Viewing Source FilesThe Source Files view lists all the source files included in the project. If you cannot step into an instruction, you can check whether the source file is actually part of the project, or whether it was compiled elsewhere. The view shows the path to each file in the file system. Right-click the view to open a context menu that contains menu items for reloading data and opening files. By default, the Source Files view is hidden. Viewing Disassembled Code and Register StateThe Disassembler view displays disassembled code for the current function. The Registers view displays the current state of the CPU's registers. The Disassembler view and the Registers view are both useful for low-level commands for checking single instructions, such as Step Into and Step Over. By default, both Disassembler and Registers view are hidden. X
|