Debugging Qt Quick ProjectsNote: You need Qt 4.7.1 or later to debug Qt Quick projects. Debugging projects not created with the Qt Quick wizards is only supported with Qt 4.8, or later. To debug Qt Quick applications running on devices, you must install Qt 4.7.4, or later, libraries on devices. To debug applications on Symbian devices, you must install also QML Viewer on them. Setting Up QML DebuggingThe process of setting up debugging for Qt Quick projects depends on the type of the project: Qt Quick UI or Qt Quick Application. To debug Qt Quick UI projects:
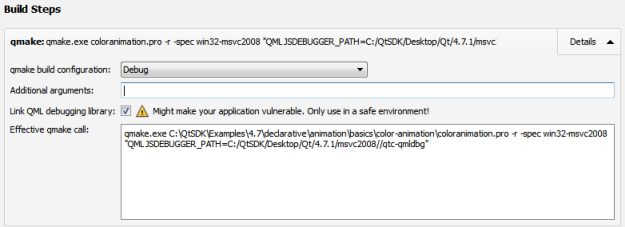
To debug Qt Quick Applications:
To debug Qt Quick Applications on devices, install Qt 4.7.4, or later, libraries on devices. Then select the device as the target before you start debugging. Mixed C++/QML DebuggingYou can debug both the C++ and QML parts of your application at the same time: Select the checkboxes for both languages in the Run Settings. However, C++ breakpoints will be ignored until the debugger has attached also to the QML engine. Starting QML DebuggingTo start the application, choose Debug > Start Debugging > Start Debugging or press F5. Once the application starts running, it behaves and performs as usual. You can then perform the following tasks:
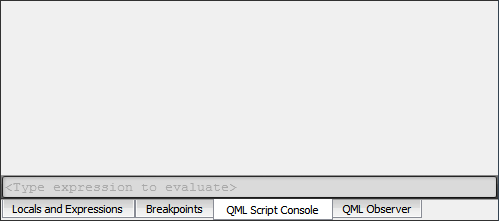
Debugging JavaScript FunctionsYou can use the Qt Creator Debug mode to inspect the state of your application while debugging. You can interact with the debugger in several ways, as described in the following sections: Executing JavaScript ExpressionsWhen the application is interrupted by a breakpoint, you can use the QML Script Console to execute JavaScript expressions in the current context. To open it, choose Window > View > QML Script Console.
You can type JavaScript expressions and use them to get information about the state or your application. For example, property values. You can see the current value of a property by hovering over it in the code editor. Applying QML Changes at RuntimeIf you change property values or add properties in the code editor, the changes are updated in the running application when you save them. If live preview is not supported for an element, a message appears. Click Reload to preview the changes. Reloading is enabled by default. To disable it, click Inspecting QML at RuntimeWhile the application is running, you can use the QML Inspector view to explore the object structure, debug animations, and inspect colors. To open the QML Inspector view, choose Window > View > QML Inspector. The view shows the properties of the currently selected QML element.
When you debug complex applications, you can use the inspection mode to jump to the position in code where an element is defined. You are switched to the inspection mode, when you click the Select, Zoom, or Color Picker button on the toolbar.
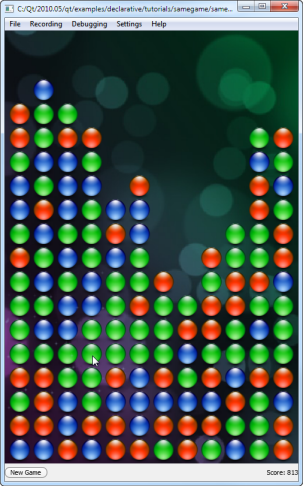
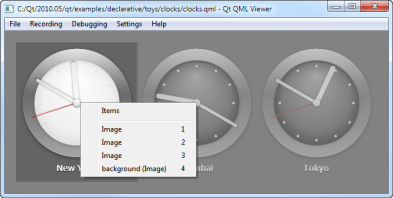
When the Select tool is enabled, you can click elements in the running application to jump to their definitions in the code. The properties of the selected element are displayed in the QML Inspector view. The element hierarchy is displayed as a bread crumb path. You can also right-click an element in the running application to view the element hierarchy as a context menu.
To switch to the zoom mode, click the Zoom button. Click in the running application to zoom in. Right-click to open a context menu that contains zoom controls. To inspect colors, click the Color Picker button. You can also click To switch out of the inspection mode, deselect the Select, Zoom, and Color Picker button. To move the application running in Qt QML Viewer to the front, select the Show Application on Top button. Debugging Animations
To play and pause animations in the running application, select the Play/Pause Animations button on the toolbar or Debugging > Animations > Pause, or press Ctrl+.. To change the speed at which animations are played, select a value in Debugging > Animations or click and hold down the Play/Pause Animations button to select a value. X
|
 on the toolbar.
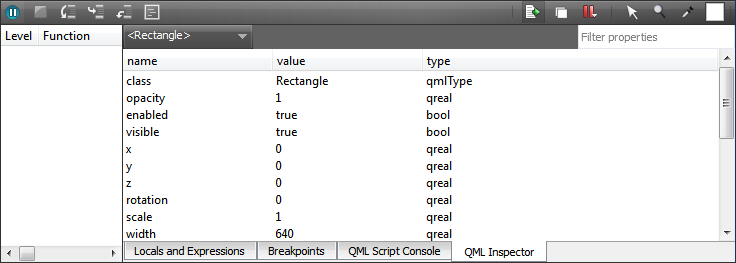

 to copy the color definition to the clipboard.