Profiling QML ApplicationsTo monitor the performance of an application in the QML Profiler:
When you start analyzing an application, the application is launched, and the QML Profiler immediately begins to collect data. This is indicated by the time running in the Elapsed field. Data is collected until you select the Do not use application commands to exit the application, because data is sent to the QML Profiler when you select the Stop button. The application continues to run for some seconds, after which it is stopped automatically. If you exit the application, the data is not sent. Select the Analyzing Collected DataThe Timeline view displays graphical representations of:
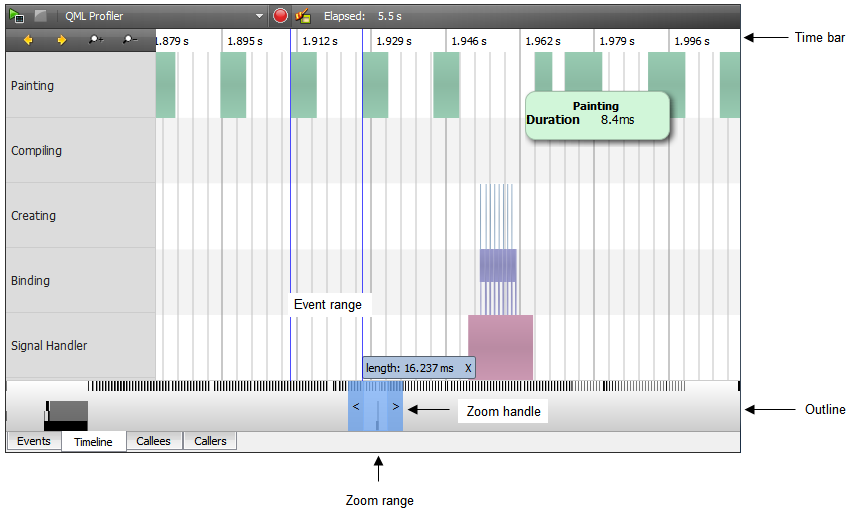
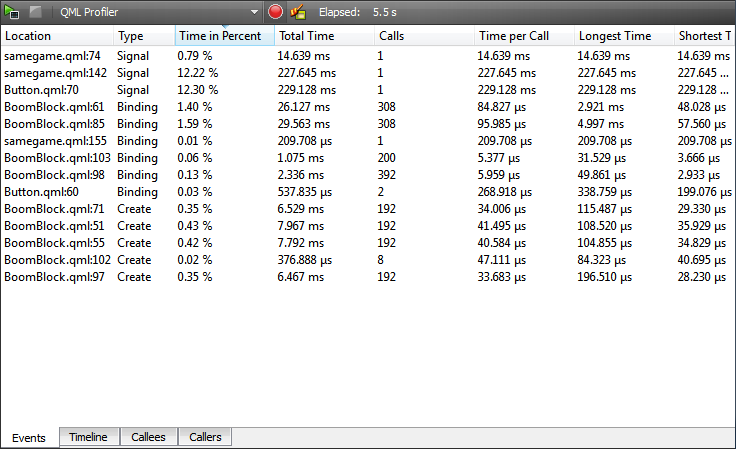
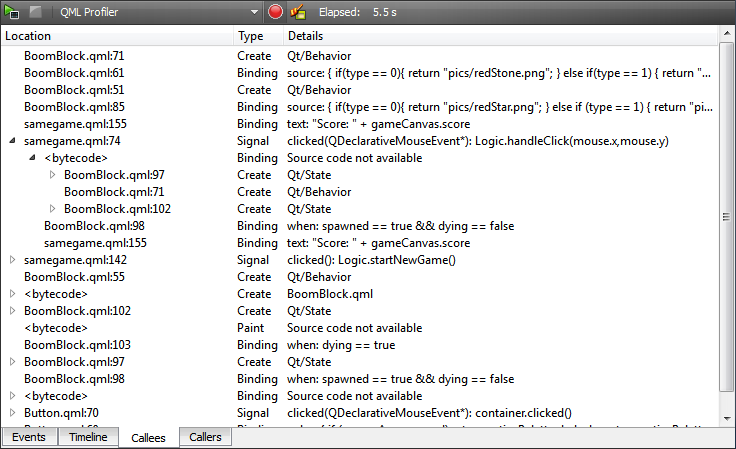
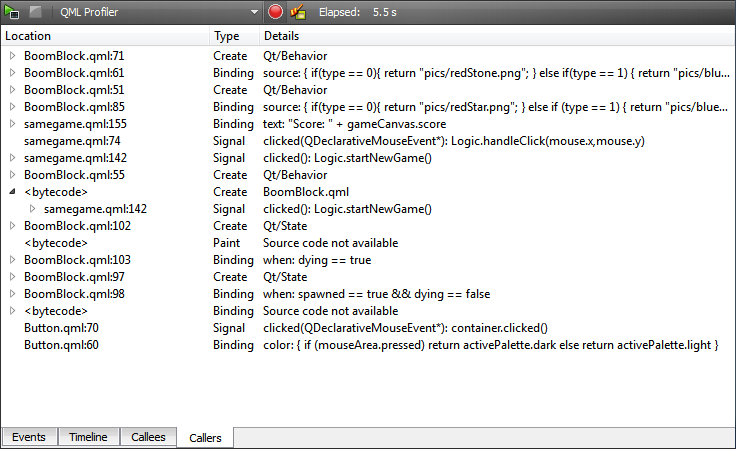
The outline summarizes the period for which data was collected. Drag the zoom range or click the outline to move on the outline. You can also move between events by clicking the Previous and Next buttons. Click the zoom buttons or drag the zoom handles to zoom in and out. You can define an event range to view the frame rate of events and to compare it with the frame rate of similar events. Click on the timeline to specify the beginning of the event range. Drag the cursor to define the end of the range. The length of the range indicates the frame rate of the event. You can drag the timeline below the event range to compare events. Additional information is displayed on the rows above the outline. Each row in the timeline describes a type of QML events that were recorded. Move the cursor on an event on a row to see how long it takes and where in the source it is being called. On the Binding row, you can see when a binding is evaluated and how long the evaluation takes. Move the mouse over the binding for details about the binding: location in the source code, duration, and source code. Click the binding to move the cursor in the code editor to the part of the code where the binding is called. The time bar at the top of the Timeline view displays the time in seconds. To see the time in milliseconds, move the mouse on the time bar. Viewing EventsThe Events view displays the number of times each binding is called and the time the calls take. This allows you to examine which events you need to optimize. A high number of calls might indicate that a binding is called unnecessarily. Click on a binding to move to it in the source code in the code editor. The Callees and Callers views show dependencies between events. They allow you to examine the internal functions of the application. The Callees view summarizes the QML events that a binding triggers. This tells you which QML events are affected if you change a binding. The Callers view summarizes the QML events that trigger a binding. This tells you what caused a change in a binding. Click on a binding to move to it in the source code in the code editor. The QML JavaScript engine optimizes trivial bindings. The QML Profiler does not receive information about optimized bindings, and therefore, it displays the text <bytecode> and the message Source code not available in the Callees and Callers views. To inspect the optimized bindings, turn off the QML optimizer by setting the environment variable QML_DISABLE_OPTIMIZER to 1. To set the environment variable for the current project in the project settings: X
|


 button to start the application from the QML Profiler.
 button.
 button. Data collection takes time, and therefore, there might be a delay before the data is displayed.


