Viadeo Twitter Google Bookmarks ! Facebook Digg del.icio.us MySpace Yahoo MyWeb Blinklist Netvouz Reddit Simpy StumbleUpon Bookmarks Windows Live Favorites 
Logo Documentation Qt ·  Page d'accueil  ·  Toutes les classes  ·  Toutes les fonctions  ·  Vues d'ensemble  · 

Profiling QML Applications

To monitor the performance of an application in the QML Profiler:

  1. To be able to profile an application, you must set up QML debugging for the project. For more information, see Setting Up QML Debugging.
  2. In the Projects mode, select Qt 4.7.4 in the Qt version field.

    Note: To profile applications on devices, you must install Qt 4.7.4 or later libraries on them.

  3. Select Analyze > QML Profiler to profile the current application.

    "QML Profiler toolbar"

  4. Select the "Start button" button to start the application from the QML Profiler.

    Note: If data collection does not start automatically, select the "Analyzer button" button.

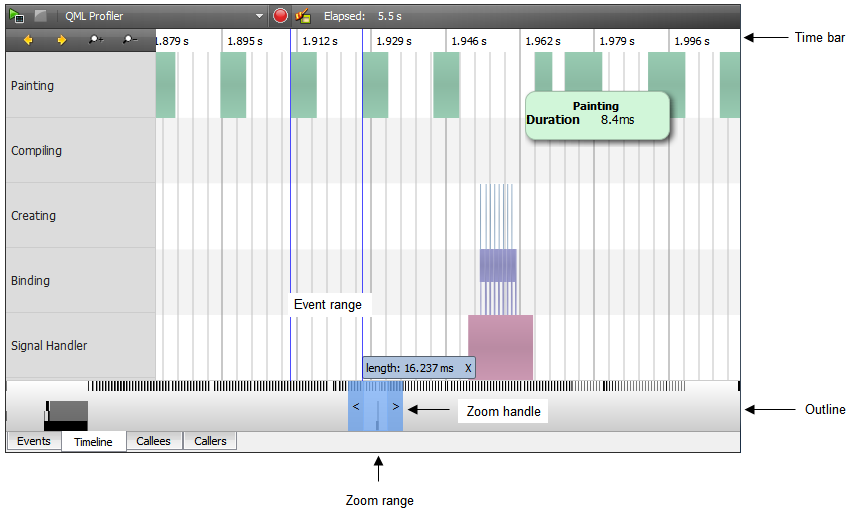
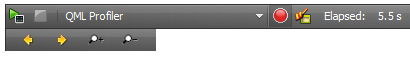
When you start analyzing an application, the application is launched, and the QML Profiler immediately begins to collect data. This is indicated by the time running in the Elapsed field.

Data is collected until you select the "Stop button" button. Data collection takes time, and therefore, there might be a delay before the data is displayed.

Do not use application commands to exit the application, because data is sent to the QML Profiler when you select the Stop button. The application continues to run for some seconds, after which it is stopped automatically. If you exit the application, the data is not sent.

Select the "Analyzer button" button to disable the automatic start of the data collection when an application is launched. Data collection starts when you select the button again.

Analyzing Collected Data

The Timeline view displays graphical representations of:

  • Painting operations
  • Compiling the QML sources
  • Creating elements
  • Binding evaluations
  • Signal handling
  • Summary of the recorded period

"QML Profiler"

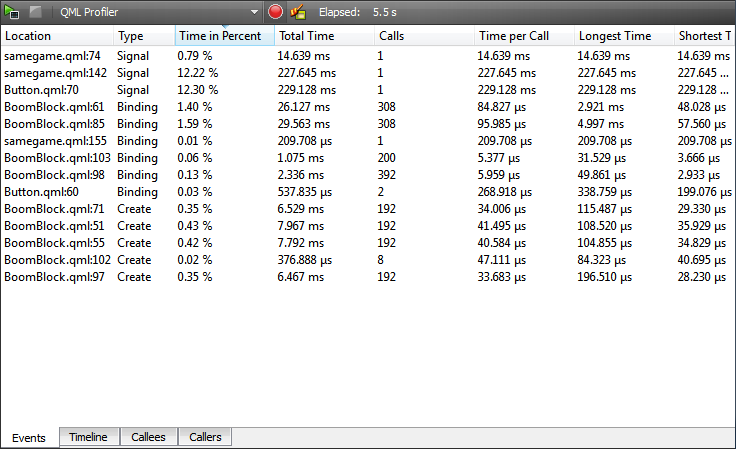
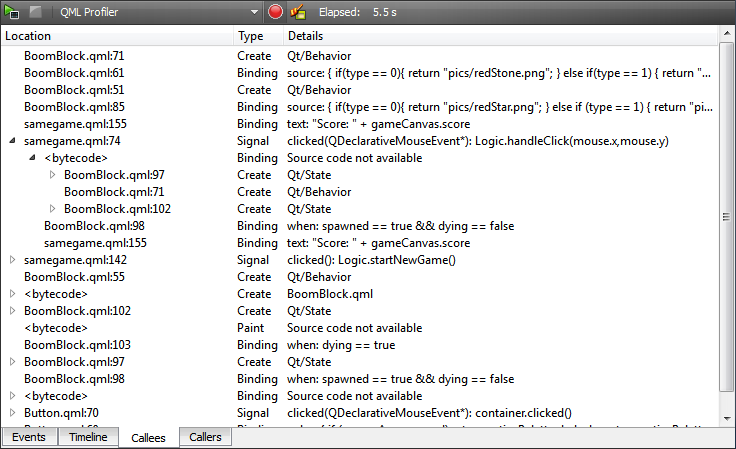
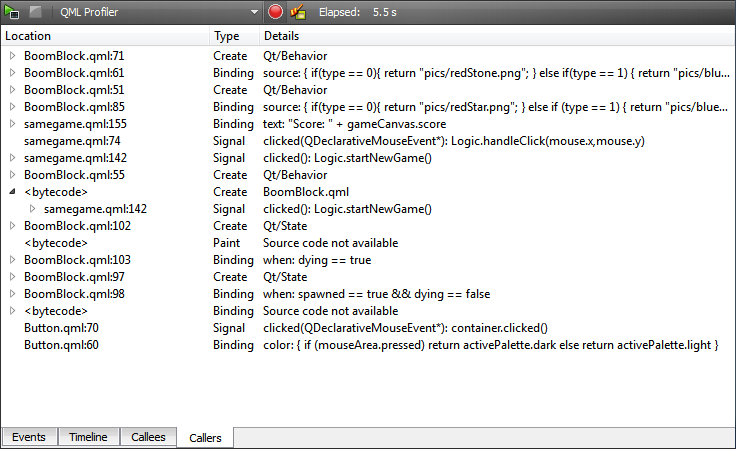
The outline summarizes the period for which data was collected. Drag the zoom range or click the outline to move on the outline. You can also move between events by clicking the Previous and Next buttons.

Click the zoom buttons or drag the zoom handles to zoom in and out.

You can define an event range to view the frame rate of events and to compare it with the frame rate of similar events. Click on the timeline to specify the beginning of the event range. Drag the cursor to define the end of the range. The length of the range indicates the frame rate of the event. You can drag the timeline below the event range to compare events.

Additional information is displayed on the rows above the outline. Each row in the timeline describes a type of QML events that were recorded. Move the cursor on an event on a row to see how long it takes and where in the source it is being called.

On the Binding row, you can see when a binding is evaluated and how long the evaluation takes. Move the mouse over the binding for details about the binding: location in the source code, duration, and source code.

Click the binding to move the cursor in the code editor to the part of the code where the binding is called.

The time bar at the top of the Timeline view displays the time in seconds. To see the time in milliseconds, move the mouse on the time bar.

Viewing Events

The Events view displays the number of times each binding is called and the time the calls take. This allows you to examine which events you need to optimize. A high number of calls might indicate that a binding is called unnecessarily. Click on a binding to move to it in the source code in the code editor.

"Events view"

Viewing Calling and Called Events

The Callees and Callers views show dependencies between events. They allow you to examine the internal functions of the application.

The Callees view summarizes the QML events that a binding triggers. This tells you which QML events are affected if you change a binding.

"Callees view"

The Callers view summarizes the QML events that trigger a binding. This tells you what caused a change in a binding.

"Callers view"

Click on a binding to move to it in the source code in the code editor.

Viewing More Data

The QML JavaScript engine optimizes trivial bindings. The QML Profiler does not receive information about optimized bindings, and therefore, it displays the text <bytecode> and the message Source code not available in the Callees and Callers views.

To inspect the optimized bindings, turn off the QML optimizer by setting the environment variable QML_DISABLE_OPTIMIZER to 1. To set the environment variable for the current project in the project settings:

  1. Select Projects > Run.
  2. In Run Environment, click Add.
  3. Add the QML_DISABLE_OPTIMIZER variable and set its value to 1.
X

Thank you for giving your feedback.

Make sure it is related to this specific page. For more general bugs and requests, please use the Qt Bug Tracker.

[0]; s.parentNode.insertBefore(ga, s); })();
Publicité

Best Of

Actualités les plus lues

Semaine
Mois
Année
  1. « Quelque chose ne va vraiment pas avec les développeurs "modernes" », un développeur à "l'ancienne" critique la multiplication des bibliothèques 82
  2. Apercevoir la troisième dimension ou l'utilisation multithreadée d'OpenGL dans Qt, un article des Qt Quarterly traduit par Guillaume Belz 0
  3. Les développeurs ignorent-ils trop les failles découvertes dans leur code ? Prenez-vous en compte les remarques des autres ? 17
  4. BlackBerry 10 : premières images du prochain OS de RIM qui devrait intégrer des widgets et des tuiles inspirées de Windows Phone 0
  5. Quelles nouveautés de C++11 Visual C++ doit-il rapidement intégrer ? Donnez-nous votre avis 10
  6. Adieu qmake, bienvenue qbs : Qt Building Suite, un outil déclaratif et extensible pour la compilation de projets Qt 17
  7. 2017 : un quinquennat pour une nouvelle version du C++ ? Possible, selon Herb Sutter 6
Page suivante

Le Qt Developer Network au hasard

Logo

Applications mobiles modernes avec Qt et QML

Le Qt Developer Network est un réseau de développeurs Qt anglophone, où ils peuvent partager leur expérience sur le framework. Lire l'article.

Communauté

Ressources

Liens utiles

Contact

  • Vous souhaitez rejoindre la rédaction ou proposer un tutoriel, une traduction, une question... ? Postez dans le forum Contribuez ou contactez-nous par MP ou par email (voir en bas de page).

Qt dans le magazine

Cette page est une traduction d'une page de la documentation de Qt, écrite par Nokia Corporation and/or its subsidiary(-ies). Les éventuels problèmes résultant d'une mauvaise traduction ne sont pas imputables à Nokia. Qt qtcreator-2.3
Copyright © 2012 Developpez LLC. Tous droits réservés Developpez LLC. Aucune reproduction, même partielle, ne peut être faite de ce site et de l'ensemble de son contenu : textes, documents et images sans l'autorisation expresse de Developpez LLC. Sinon, vous encourez selon la loi jusqu'à 3 ans de prison et jusqu'à 300 000 E de dommages et intérêts. Cette page est déposée à la SACD.
Vous avez déniché une erreur ? Un bug ? Une redirection cassée ? Ou tout autre problème, quel qu'il soit ? Ou bien vous désirez participer à ce projet de traduction ? N'hésitez pas à nous contacter ou par MP !


Partenaires

Hébergement Web